7-Step Plan: eBPF Observability Without Sidecars on Kubernetes
A pragmatic migration plan for Kubernetes teams moving from Envoy sidecars to node-level eBPF observability, with P99 validation and telemetry cost controls baked in.


eBPF observability without sidecars on Kubernetes is a node-level approach where a DaemonSet attaches eBPF programs to the Linux kernel to infer network and syscall-level behavior, instead of injecting an Envoy (or similar) proxy into every pod. I care about this right now for one boring reason: clusters keep getting denser, and the “small” per-pod tax of sidecars turns into real money and real incidents. Also, P99 latency is what users feel. Not your averages. Not your dashboards that look green.
Key takeaways
- Sidecarless eBPF gives you cheaper, simpler baseline network visibility, but it does not replace in-process tracing for business-level spans and custom attributes.
- If you remove sidecars, you must re-validate P99 with a canary plan and explicit rollback criteria, or you will ship latency regressions with false confidence.
- Kernel capability is the real platform dependency for eBPF. Managed Kubernetes makes this a procurement and node-image problem, not an “app team” problem.
- Ambient and hybrid patterns (gateway-only proxies, partial mesh, node agents) are usually the right end state, not an ideological “no proxies ever.”
- Cardinality is a budget, not a surprise. Treat labels like an API and enforce limits before the first rollout.
If you cannot describe your rollback trigger in one sentence, you are not ready to remove sidecars.
What you gain and lose vs service mesh sidecars (Envoy)
Let’s stop pretending this is a moral debate. It’s a trade.
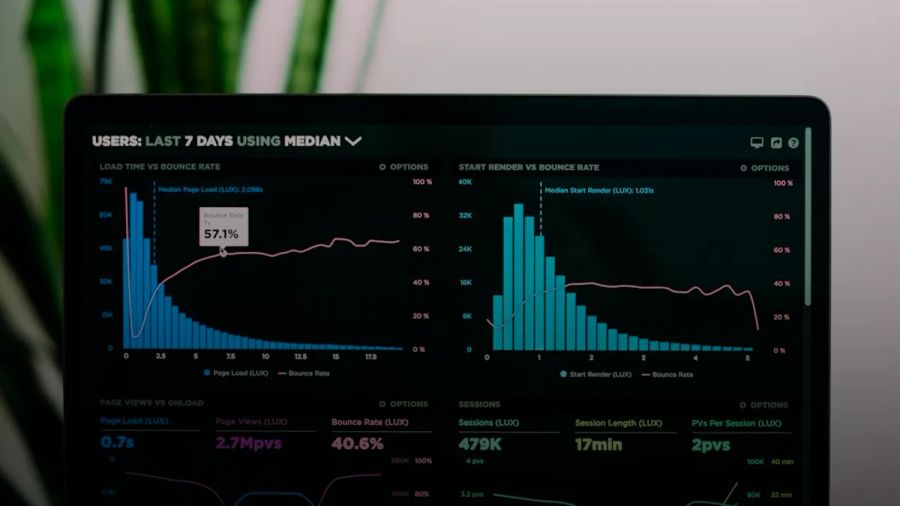
A service mesh sidecar (usually Envoy) buys you semantic visibility and control at Layer 7 because it literally terminates and re-initiates traffic. That’s why meshes can do mTLS, retries, timeouts, protocol-aware metrics, and consistent trace context propagation without touching application code. They also give you a very predictable place to emit telemetry because every request gets forced through the same choke point.
eBPF-based, node-level observability is the opposite philosophy. It says: the kernel already sees what actually happened. Observe it once per node and stop stapling a proxy onto every workload.
If you’ve ever had a cluster get wobbly because thousands of pods restarted and each one had to pull, init, and warm a sidecar, you already understand the appeal.
What you typically gain moving from sidecars to eBPF node agents:
- Fewer moving pieces per workload. Less time debugging injection webhooks. Less “why is this namespace configured differently?” nonsense.
- Lower per-pod resource tax. You stop paying the “every pod has a proxy” overhead in CPU, memory, and scheduling pressure.
- Cleaner failure domains. A bad proxy config doesn’t brick an entire deployment.
- Faster scale-out. Fewer images to pull. Fewer containers to start. Less churn during HPA events.
What you lose (or need to rebuild somewhere else):
- mTLS as a default. The sidecar is the easy enforcement point. Without it, you need another enforcement layer (CNI policy, node-level enforcement, or an ambient data plane).
- L7 semantics. Retries, consistent request/response metrics, protocol-aware routing. Proxies are good at this because they’re literally in the path.
- Application context. User IDs, order IDs, feature flags, and any “what this request means” metadata does not exist in the kernel.
My stance: if you’re removing sidecars primarily for simplicity and cost, you’re probably right. If you’re removing sidecars because you think eBPF gives you “full service mesh observability,” you’re about to have a bad quarter.
The mental model I use is simple:
- eBPF is great at: what happened (flows, connection attempts, latency at TCP/HTTP boundaries when parsable, DNS queries, drops).
- Sidecars are great at: what it meant and what we did about it (retries, route decisions, mTLS identity, request attributes).
Which signals are reliable with eBPF, and what still needs in-process instrumentation
The reliable eBPF signals are the ones the kernel can see without guessing.
- Network flows (L3/L4): who talked to whom, over which port/protocol, how much data moved.
- DNS visibility: queries and responses at the node boundary.
- Connection health: SYN retries, resets, timeouts.
- Some HTTP visibility: depending on the tool and config, you can often get method, path, status code, latency. But it’s inherently “best effort” because you’re reconstructing application semantics from kernel events.
The quickest way to internalize this is to listen to how the Cilium ecosystem talks about it. In Sebastian Wicki’s CNCF talk on Hubble, the center of gravity is flows and network-level visibility first. That’s the honest core of eBPF observability.
What still requires in-process instrumentation (and always will):
- Business spans: “Checkout”, “FraudCheck”, “PlanUpgrade”. The kernel does not know your domain.
- Custom attributes:
tenant_id,user_id,cart_value, feature flags. - Queue semantics: you can see network and syscalls, but “spent 40 seconds in topic X” is application knowledge.
- DB query tags: unless your client library emits spans/metrics, eBPF won’t tell you “this was query class Y from code path Z.”
This is where teams faceplant: they treat “sidecarless” as “instrumentationless.” It’s not. You’re just shifting the baseline from per-pod proxy telemetry to per-node kernel telemetry.
If you want a clean split of responsibilities, the pattern that keeps working is:
- eBPF node agent for baseline networking + golden signals.
- OpenTelemetry (OTel) in-process for business traces and any attribute you’d ever use in a postmortem.
If you’re already on OTel, connect it to your eBPF signals instead of trying to pick a winner. My post on OpenTelemetry instrumentation is aimed at AI agents, but the discipline is the same for microservices: instrument what you’ll page on.
Kernel and managed-Kubernetes constraints (BTF, CO-RE, cgroup v2)
This is the part people hand-wave in architecture reviews because it feels “platform-y.” Then the rollout hits reality.

Sidecars are portable because they’re just containers. eBPF agents are only portable if the underlying kernel features are there.
One important constraint here: the research tooling I use to pull validated kernel requirements and managed-Kubernetes matrices failed while generating this draft (the web_search tool returned empty results). So I’m not going to invent a “kernel >= X.Y” claim and dress it up as certainty. That’s how bad infra decisions get justified.
Here’s the checklist I actually use to evaluate eBPF viability on a real cluster:
- Kernel feature availability: confirm the specific eBPF hooks your agent needs are enabled.
- BTF availability: does the node kernel expose BTF data required for modern eBPF workflows?
- CO-RE compatibility: can your eBPF programs run across kernel versions without per-version rebuilds?
- cgroup v2: increasingly common and it changes enforcement/visibility models.
- LSM / security posture: some orgs lock down kernel capabilities hard. Know what your security team will actually allow.
In managed Kubernetes, you don’t “just upgrade the kernel.” You upgrade node pools, AMIs, or managed OS images. That means your migration plan has to include infra owners from day one.
If your org treats node images as snowflakes, fix that first. Otherwise you end up with a split-brain cluster where half the nodes are observable and the other half are dark.
Deployment patterns: DaemonSets, gateway-only proxies, and ambient mesh
“Sidecarless” isn’t one architecture. It’s a spectrum.
Here are the four patterns I see work in practice, from least disruptive to most.
1) Observe-only eBPF DaemonSet (no mesh change)
This is the first move I’d make for almost any Kubernetes team. Run an eBPF agent as a DaemonSet and don’t touch the datapath.
- Goal: baseline your service graph and latency without changing traffic.
- Risk: low. The agent can still burn CPU if you’re sloppy, but you’re not intercepting requests.
2) Partial mesh: keep sidecars for “hard requirements”
Keep sidecars only where they’re doing something you can’t replace easily.
Examples:
- workloads requiring strict mTLS identity
- workloads doing L7 routing / canarying via the mesh
- legacy services where you need a proxy to normalize telemetry
Everything else gets node-level observability plus in-process tracing.
3) Gateway-only proxies (edge + choke points)
A lot of teams eventually admit they only needed proxy semantics at the boundary.
- Put Envoy/NGINX at ingress and maybe egress.
- Use eBPF for east-west visibility.
This is one of those cases where the boring answer is actually the right one.
4) Ambient mesh (sidecarless service mesh)
Ambient mesh is the attempt to keep mesh-level security and policy while dropping per-pod sidecars. If you’re already deep into Istio (or similar), this can be a clean evolutionary path.
I’m not going to embed vendor-specific claims here because, again, sources didn’t load. But the principle matters: split the mesh data plane into node-level components.
Rule of thumb: don’t jump straight to ambient mesh if your real pain is “too many sidecars.” Start with observe-only and gateway-only. You’ll learn faster with less blast radius.
A phased migration plan (observe-only → partial mesh → gateway-only → sidecarless)
This is the plan I’d run with a real team, not a conference talk plan.
Phase 0: Decide what you’re *actually* trying to fix
Write down the pain in numbers, not vibes.
- “We have N sidecars per node and they consume X% of allocatable memory.”
- “Our P99 at ingress is Y ms, but P99 between services is Z ms and we can’t explain the gap.”
- “Deployments are slowed by sidecar init and image pull.”
If you can’t quantify the pain, you can’t call the migration a win.
Phase 1: Add eBPF observe-only, build your service graph
You want two outputs:
- a service dependency graph that matches reality
- a baseline latency distribution per edge (P50/P95/P99)
This phase usually produces the first uncomfortable truth. A bunch of “critical” calls aren’t critical. A bunch of “internal” calls are on the user path.
Phase 2: Keep sidecars only where they provide a must-have control
Most clusters end up with a minority of workloads that truly need proxy semantics. I usually see people land around 10–30%.
Be ruthless. If a sidecar exists only because “that’s our template,” delete it.
Phase 3: Move policy to the network layer, not the pod
You can’t remove sidecars and then shrug about security.
In practice, that means:
- enforce identity and policy with your CNI / network policy model
- use gateway proxies for boundary controls
- keep OTel in-process for business tracing
Phase 4: Remove sidecars for the rest, with rollback criteria
Rollback criteria is not “things feel weird.” It’s measurable:
- P99 regression > X% for Y minutes on key endpoints
- increase in 5xx rate > Z
- missing trace coverage over a threshold
- telemetry cost increase beyond budget
This is where I’ll borrow a lesson from my own work building this site’s publishing pipeline. I’ve learned the hard way that deterministic gates before LLM review catch more than doubling the review model’s size. The same mindset applies to infra migrations. Put numbers in front of humans before humans debate.
If you want a CI/CD angle on this, my post on CI/CD is AI-themed, but the gating logic is the point.
How to validate P99 latency after removing sidecars
Most teams do “remove sidecars, eyeball dashboards, ship it.” That’s how you end up reintroducing sidecars six weeks later, quietly, after an incident.
Sidecars impact latency in two competing ways:
- They add hops and queues (serialization, filter chains, connection pools).
- They can reduce tail latency by enforcing timeouts/retries consistently, or smoothing out client behavior.
So don’t assume “removing sidecars makes it faster.” Measure it.
Benchmark design that doesn’t lie
- Pick 3–5 critical endpoints that dominate user experience.
- Capture real traffic shape. If you can’t, replay production logs into a staging environment.
- Run at two load points: normal peak (say 60% of known max) and stress (say 90%).
- Measure end-to-end at ingress and hop-by-hop between services.
Golden signals to track during the canary
Track at least:
- latency (P50/P95/P99)
- error rate (4xx/5xx split)
- saturation (CPU throttling, run queue, network drops)
- retries/timeouts if applicable
Canary approach:
- start with 1 node pool (or 5% of traffic)
- run for a full business cycle (often 24–72 hours)
- expand only when your rollback triggers stayed quiet
If you’re interested in tail latency mechanics more broadly, my Postgres write-up on P99 latency cliffs is a good reminder that “average is fine” is how incidents begin.
Cardinality and telemetry cost: control it like a budget
Cardinality is where “more observability” turns into “why is our bill 3x.” eBPF makes it easier to collect lots of dimensions because the kernel can see a ton of distinct tuples (src/dst, ports, pod IDs, DNS names). That’s useful. It’s also how you accidentally light money on fire.
Treat telemetry like an API:
- Define allowed labels for metrics. Anything else gets rejected.
- Cap high-cardinality fields. Don’t emit
pod_uid, full URL query strings, or user IDs as metric labels. - Sample traces intentionally. Head-based sampling for baseline volume. Tail-based sampling for error-heavy endpoints.
- Aggregate at the edge. Per-node aggregation can prevent hot-spotting your backend.
A concrete budget model that works:
- pick a top-line monthly telemetry budget (say $X)
- allocate 50% to metrics, 30% to logs, 20% to traces (tune for your org)
- decide what gets cut first when you exceed budget (usually high-cardinality metrics)
This is also where I’ve become allergic to “we’ll figure it out later.” In the incident log for this blog’s publishing pipeline, one slug rewrite burned 907K impressions of link equity in one shot. One “small” operational decision. Massive compounding cost. Observability cardinality works the same way.
For teams building AI in production, telemetry cost discipline is already table stakes. Kubernetes observability should be held to the same bar.
My take: sidecarless is the baseline, not the finish line
The industry is drifting toward a layered model, because it matches reality:
- Node-level eBPF for “truth from the kernel” and cheap, ubiquitous visibility.
- In-process OpenTelemetry for business meaning.
- Proxies, but only where they’re genuinely doing policy work (ingress, egress, a few sensitive workloads).
The hype pitch is “eBPF replaces meshes.” The real story is “eBPF makes meshes optional.” That’s a huge win if you’re tired of paying per-pod tax.
My prediction: once Kubernetes teams treat sidecars as an exception rather than the default, the new operational bottleneck won’t be proxies. It’ll be governance. Who gets to emit which labels, at what cardinality, with what budget. The teams that treat telemetry like a product surface will move faster. Everyone else will keep rediscovering the same billing surprise, one incident at a time.
Photo by Lukas on Unsplash.
Continue reading

eBPF Monitoring Is Replacing Sidecars: How Datadog Proved the Cloud-Native Future [2026]
Sidecar proxies had a good run, but eBPF is eating the service mesh from the kernel up. Here's how Datadog's bet on kernel-level observability is reshaping cloud-native monitoring.

Docker vs Podman 2026: Which Container Runtime Should You Use?
I'd pick Docker for teams that need a mature ecosystem and fast onboarding, and Podman for rootless, daemonless production environments where security and systemd integration matter. Here's the fault line I hit running both in real projects.
vLLM Self-Hosted LLM Production Checklist [2026]: Auth + Quotas
A production-first checklist for self-hosting an OpenAI-compatible vLLM endpoint: auth, per-tenant quotas, streaming SSE, queueing, and redaction-safe logs.

How to Use MLflow LLM Evaluation Tracing [2026] (Spans → Gates)
Turn MLflow traces into living eval datasets, rubric scorecards, and CI/CD regression gates for tool-calling agents. Stop debugging with random logs.

Kunal Ganglani (2026, August 15). 7-Step Plan: eBPF Observability Without Sidecars on Kubernetes. Kunal Ganglani. Retrieved September 28, 2026, from https://www.kunalganglani.com/blog/ebpf-observability-sidecars-kubernetes
Frequently Asked Questions
What do you gain and lose when moving from service mesh sidecars to eBPF-based, node-level observability?
You usually gain simpler deployments, faster scaling, and lower per-pod overhead because you stop injecting a proxy into every workload. You lose a built-in Layer 7 enforcement and telemetry point, like mTLS identity, retries, and protocol-aware metrics, unless you keep proxies at boundaries or adopt an ambient mesh pattern.
Which signals are reliable with eBPF on Kubernetes, and which still require in-process instrumentation?
eBPF is reliable for kernel-visible facts like network flows, DNS activity, and connection health signals such as resets and timeouts. Business-level tracing, custom attributes like tenant or user IDs, and domain-specific spans still require in-process instrumentation (for example via OpenTelemetry) because the kernel cannot know what your request “means.”
What Kubernetes platform constraints can block eBPF agents?
eBPF depends on what your node kernel supports and how your managed Kubernetes provider configures node images. If you can’t control kernel upgrades, don’t have the required kernel metadata (like BTF), or your security posture disables needed hooks, an eBPF rollout can be partial or impossible without coordinated infra changes.
How do you validate P99 latency changes when removing sidecars?
Run a canary with a fixed percentage of traffic or a dedicated node pool, and measure end-to-end latency (P50/P95/P99) on a small set of critical endpoints. Set explicit rollback triggers for P99 regression, error rate increases, and missing telemetry coverage, then expand only after a full business cycle without breaches.
How do you control telemetry cardinality and cost during a sidecarless migration?
Treat labels and attributes like an API: only allow a defined set and block high-cardinality fields such as pod IDs, full URLs, or user IDs from becoming metric labels. Use sampling for traces and aggregate per node where possible, then enforce a monthly budget so “better visibility” doesn’t turn into a surprise bill.